Reconditioning throughput measured by vehicle, not line item
A per-vehicle model reveals how inventory moves through inspection and detail, where time accumulates, and how work is distributed.
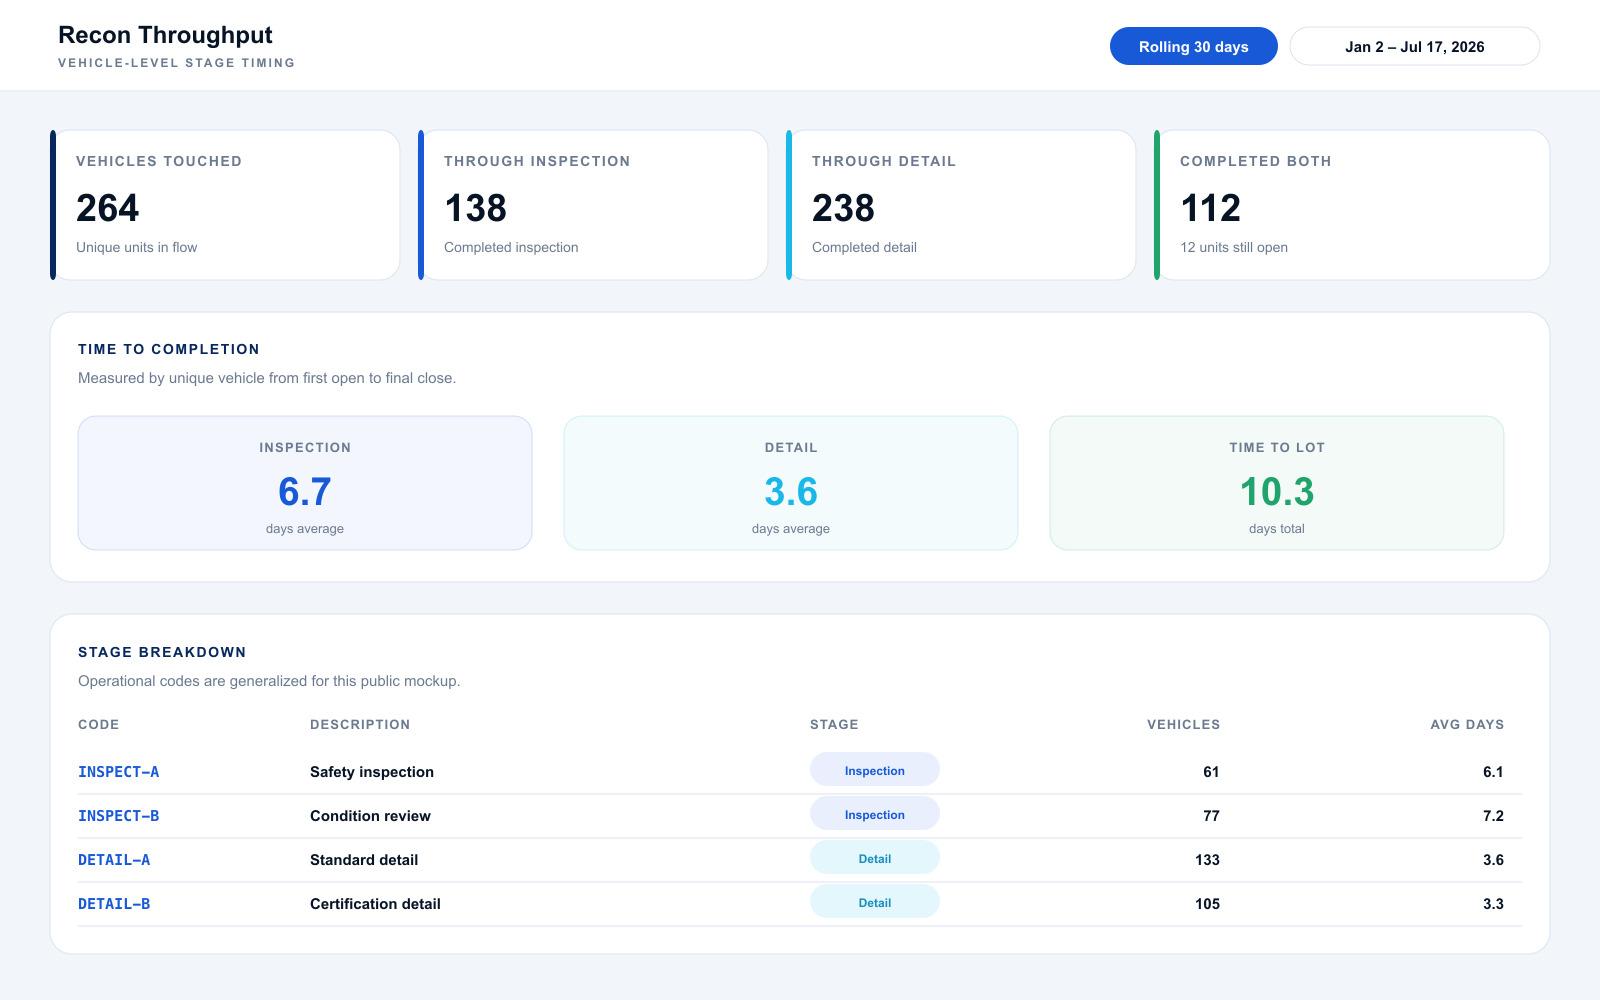 Synthetic data mockup
Shift 01
Vehicle-level truth
Duplicate lines no longer inflate the flow
Shift 02
Stage visibility
Inspection and detail time can be examined separately
Shift 03
Actionable workload
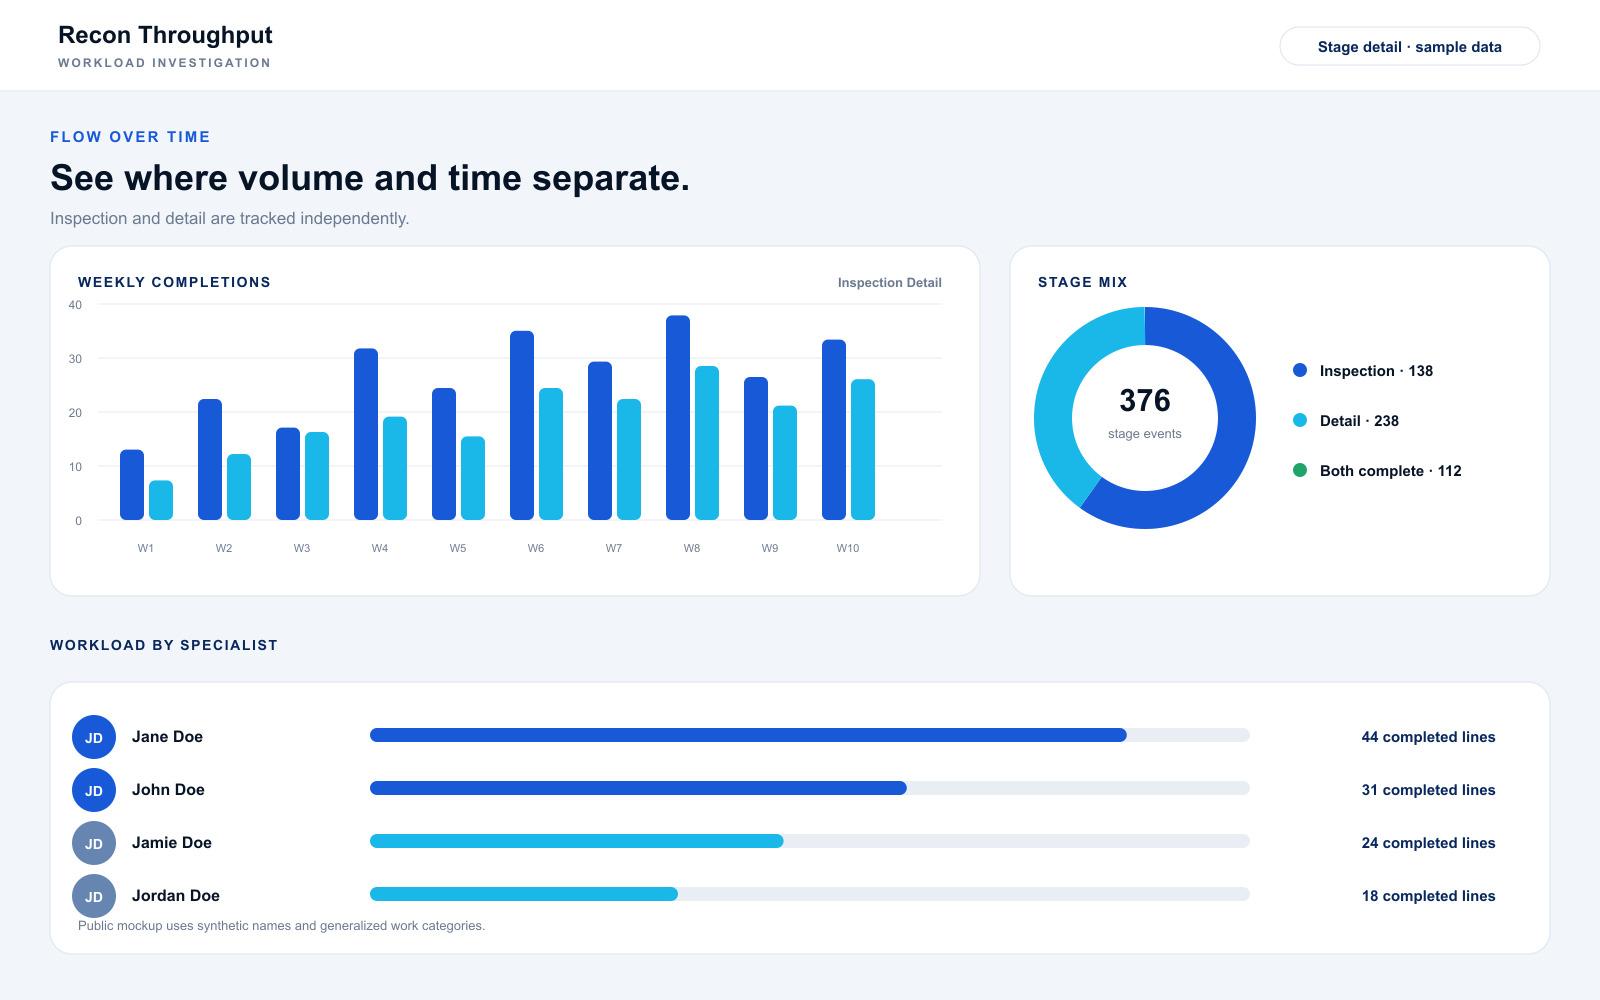
Teams can trace delays to stage, code, week, or role
01 / Challenge
The friction hiding inside the existing process.
Repair-order exports counted operation lines, not the actual flow of unique vehicles. Duplicate lines and multiple orders obscured inspection time, detail time, and the full path back to the lot.
02 / Response
A focused system, not another layer of admin.
A throughput dashboard groups records by vehicle, measures each stage from first open to last close, and exposes time-to-lot, operation mix, weekly flow, and workload by technician.
Inside the system
The workflow, made visible.
Supporting views show how raw inputs become a usable operating layer.
Capture privacy
Vehicle identifiers, repair orders, operation codes, and staff names are replaced with generalized sample data and synthetic identities. Client branding and browser URLs are excluded, and the live internal dashboard is intentionally unlinked.
More work
Keep exploring.
Have a process like this?