A live incentive dashboard built from three dealership reports
A shared sales and finance challenge turns separate exports into transparent standings, goal progress, and payout scenarios.
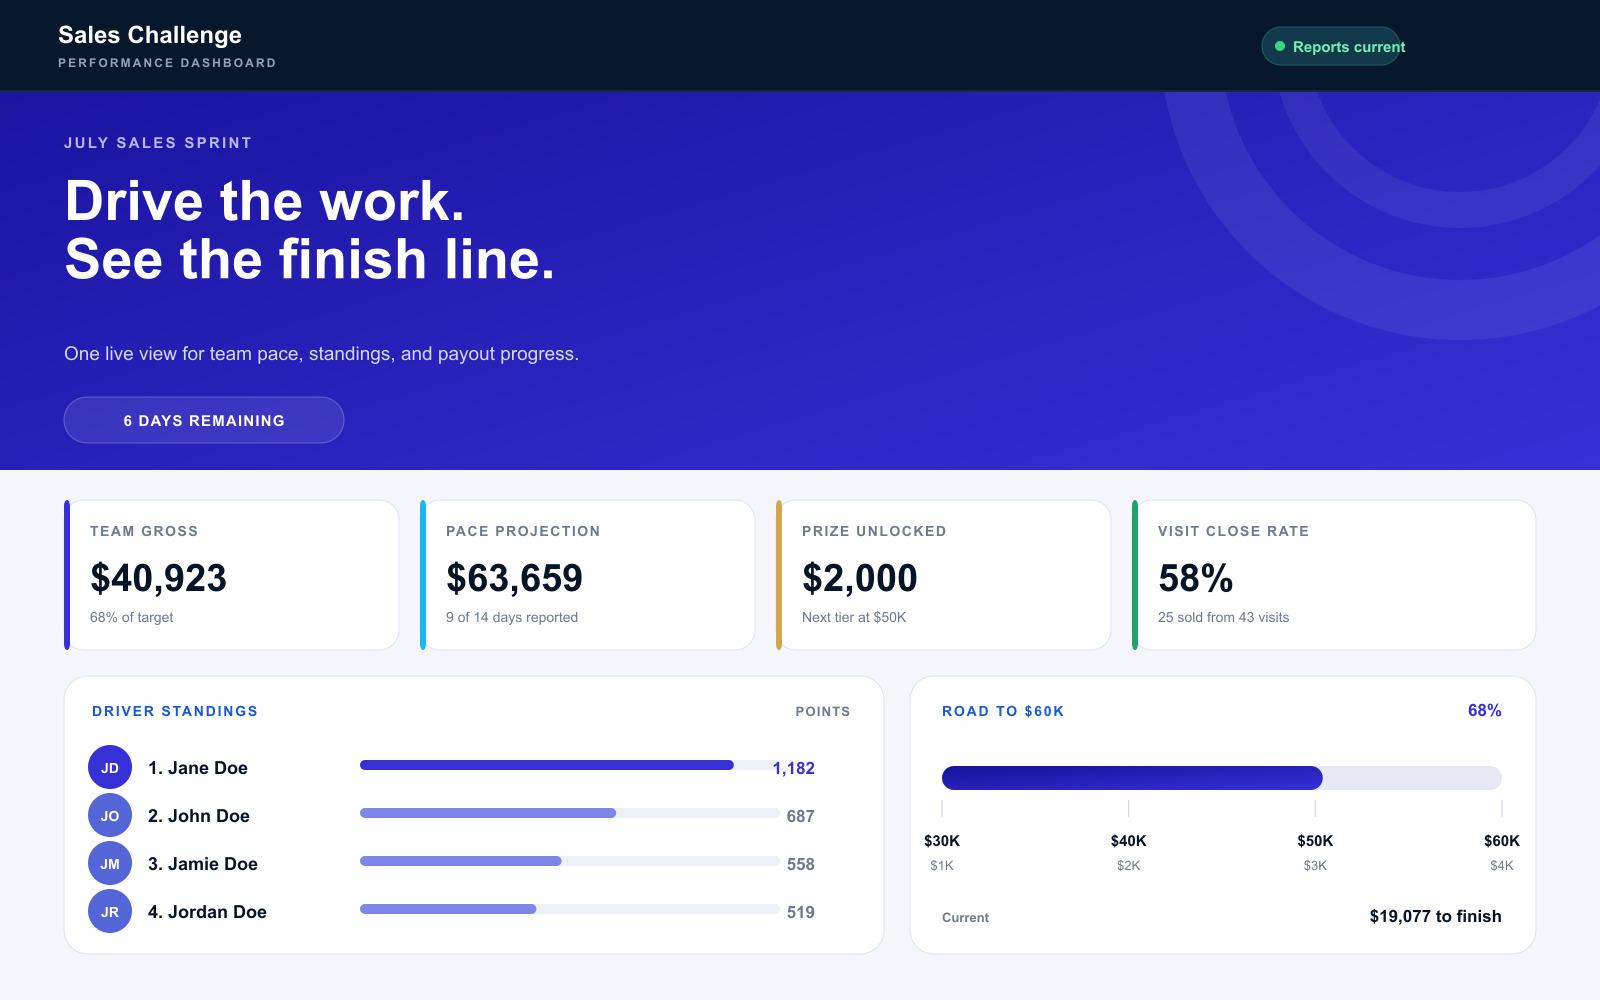 Synthetic data mockup
Shift 01
One shared view
Three reports reconciled into a single race
Shift 02
Repeatable refresh
A defined workflow replaces ad hoc scorekeeping
Shift 03
Auditable rules
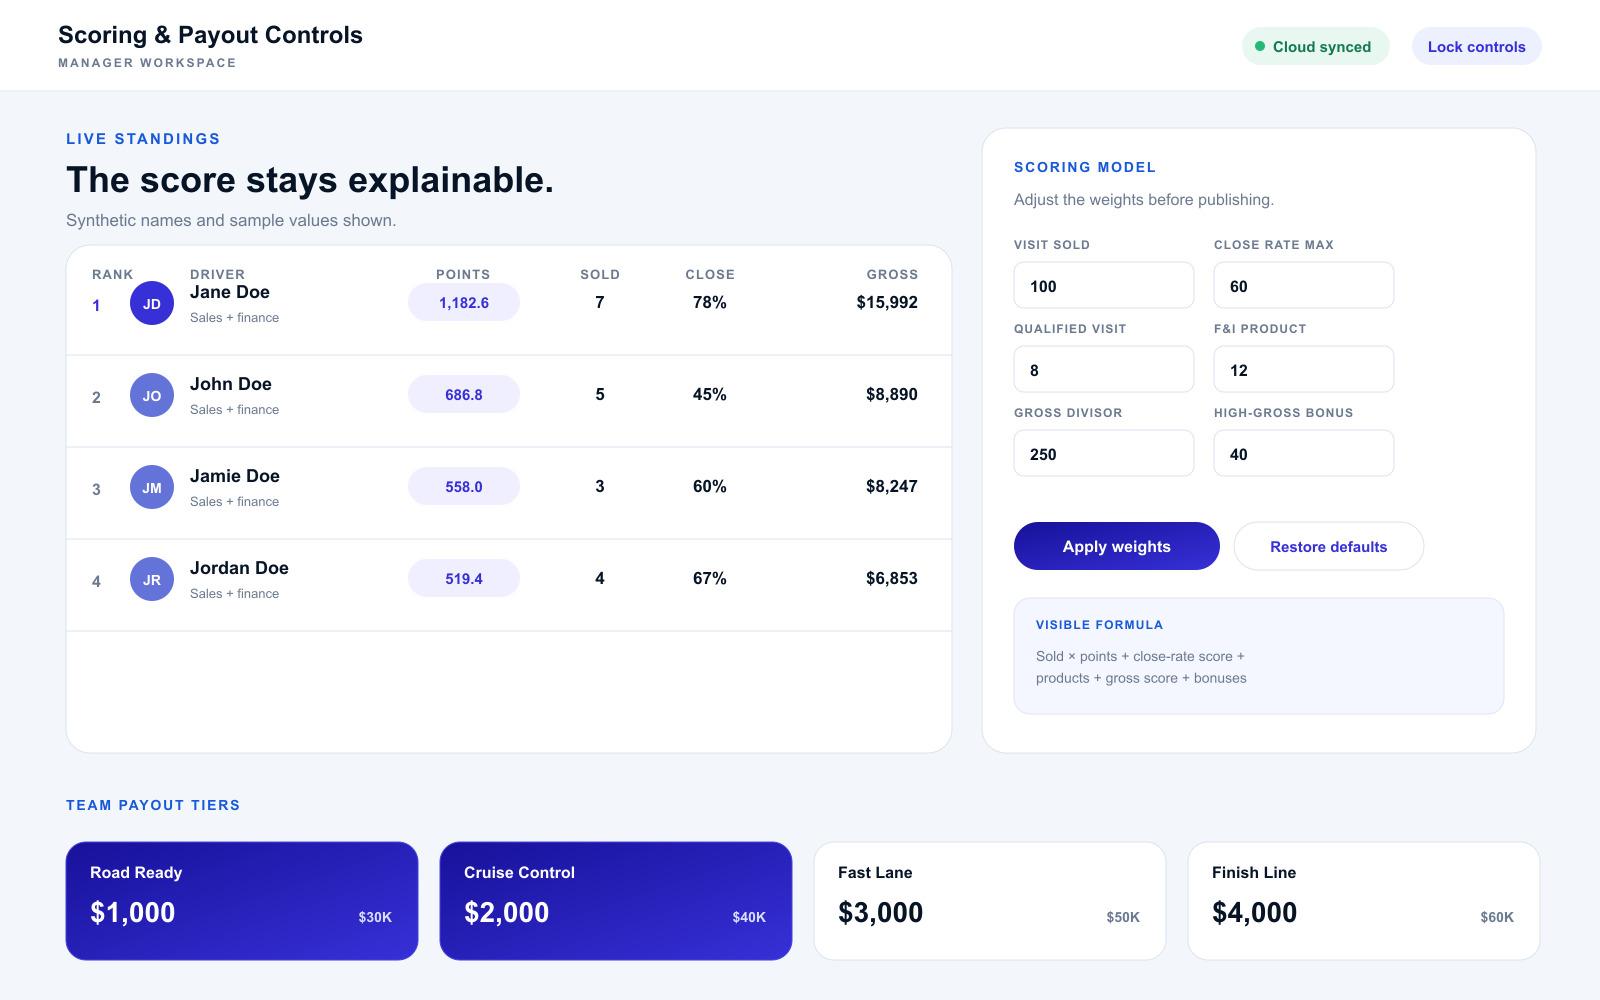
Every standing traces back to a visible formula
01 / Challenge
The friction hiding inside the existing process.
Lead conversion, finance counts, and finance gross arrived in separate reports. Running a short incentive program meant reconciling those exports, applying a custom score, and explaining standings by hand.
02 / Response
A focused system, not another layer of admin.
A browser-based report workflow combines the three inputs into a shared race dashboard with driver standings, team goals, payout tiers, and an auditable score breakdown.
Inside the system
The workflow, made visible.
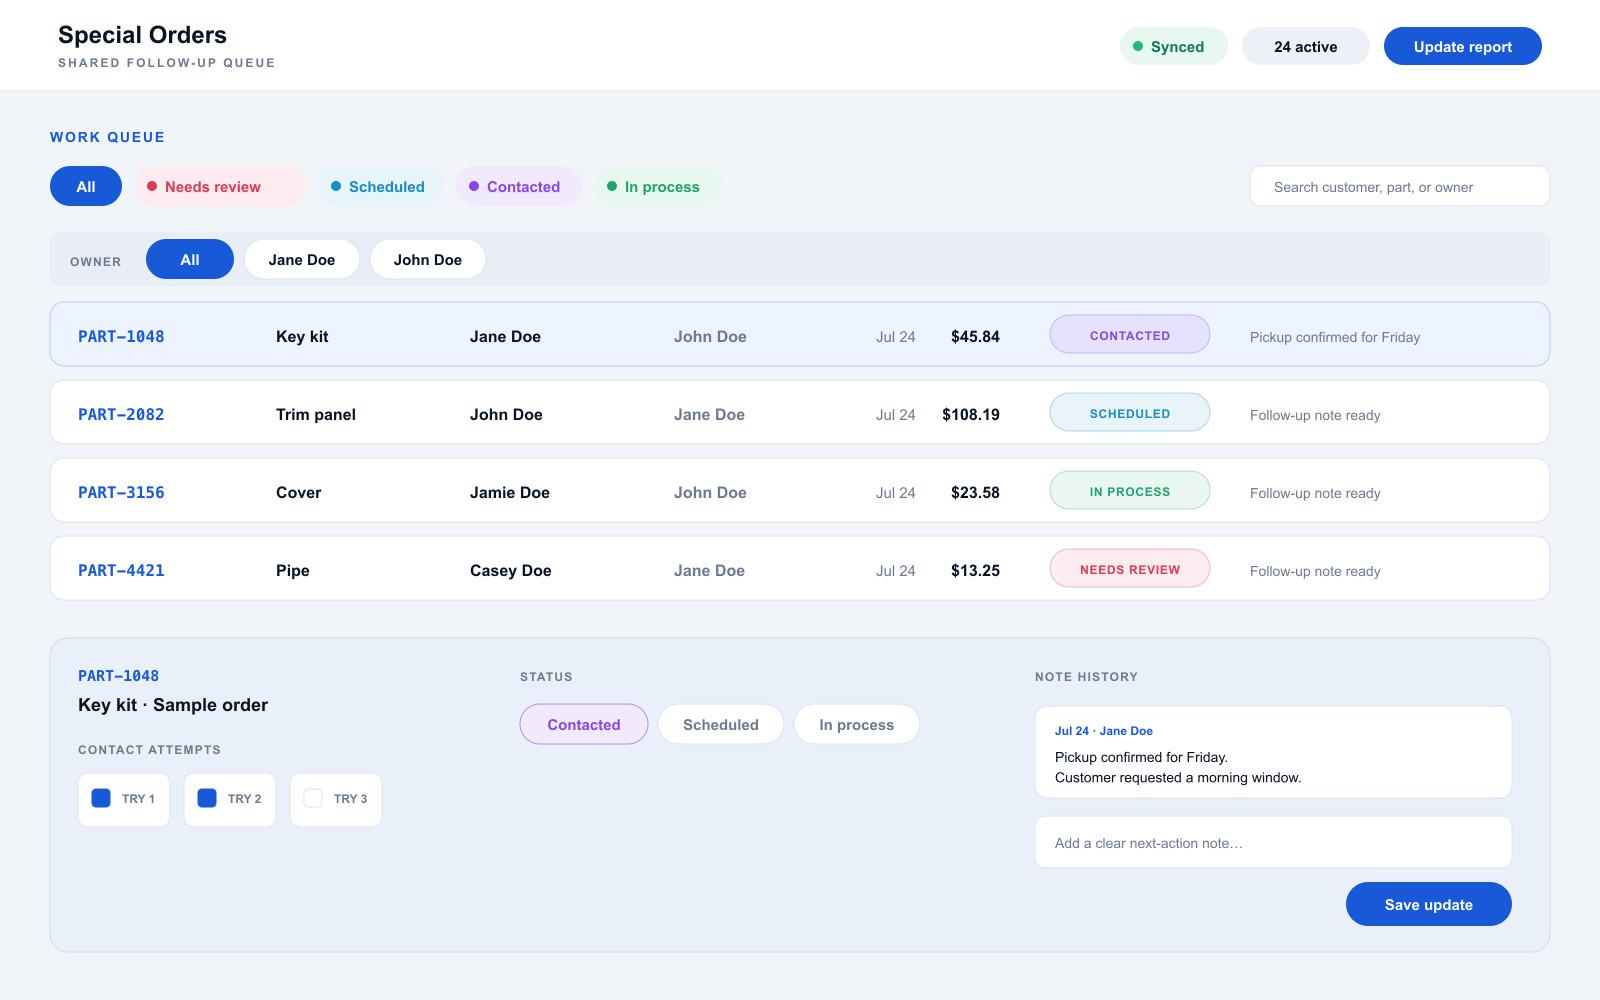
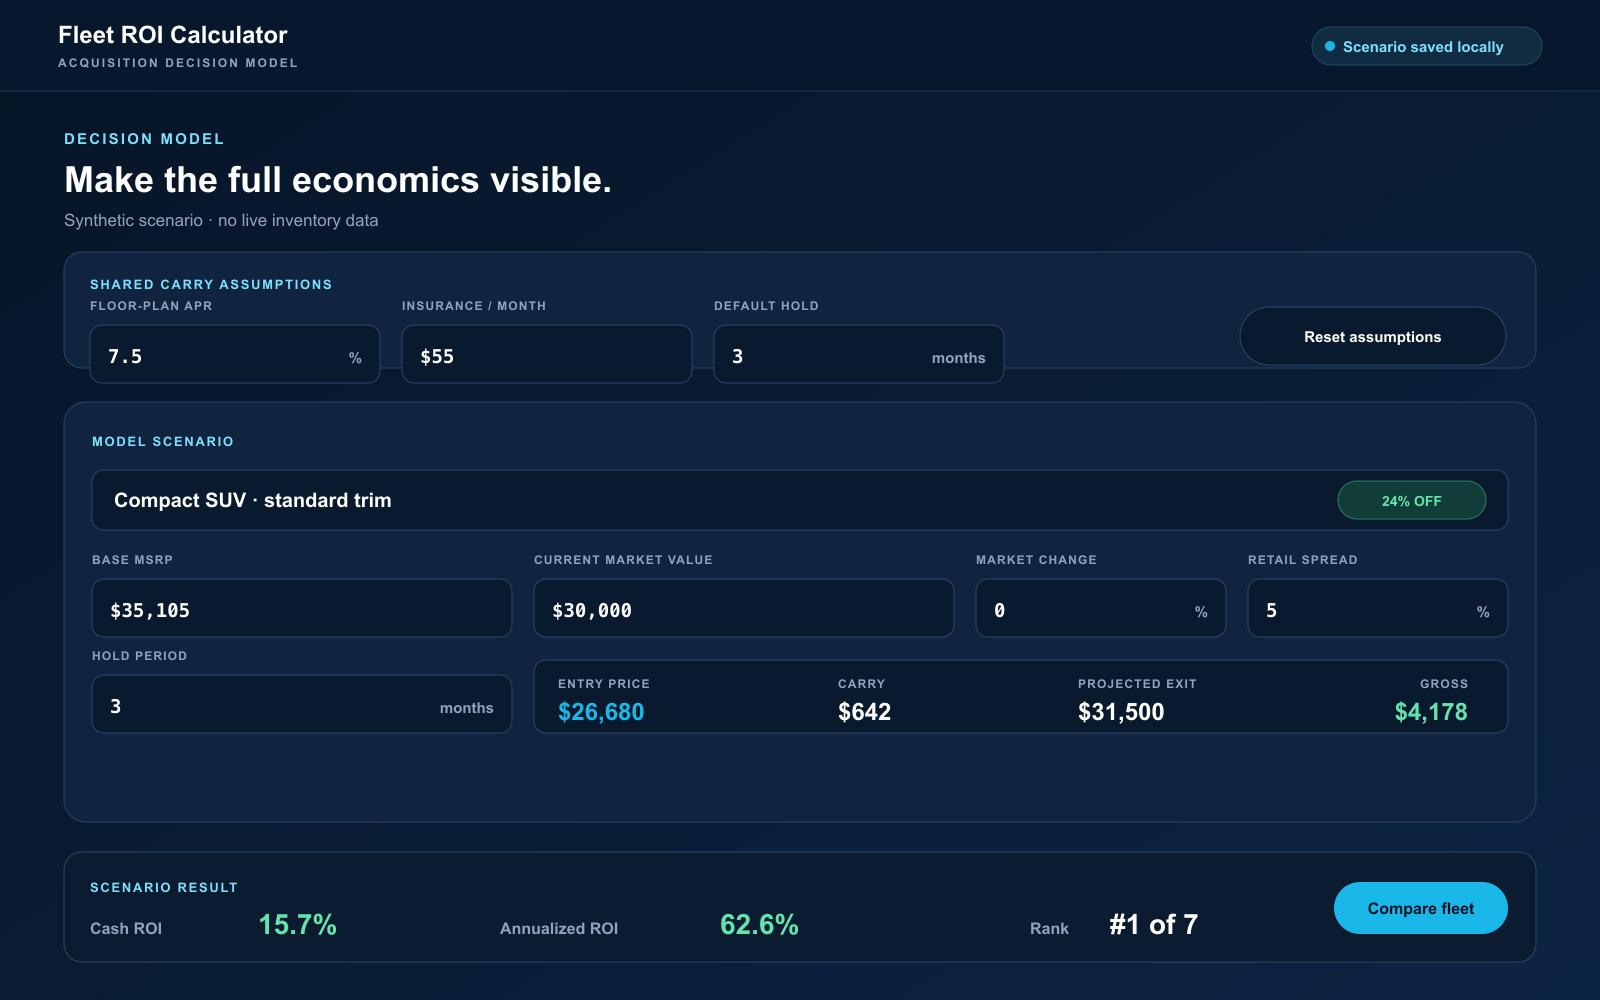
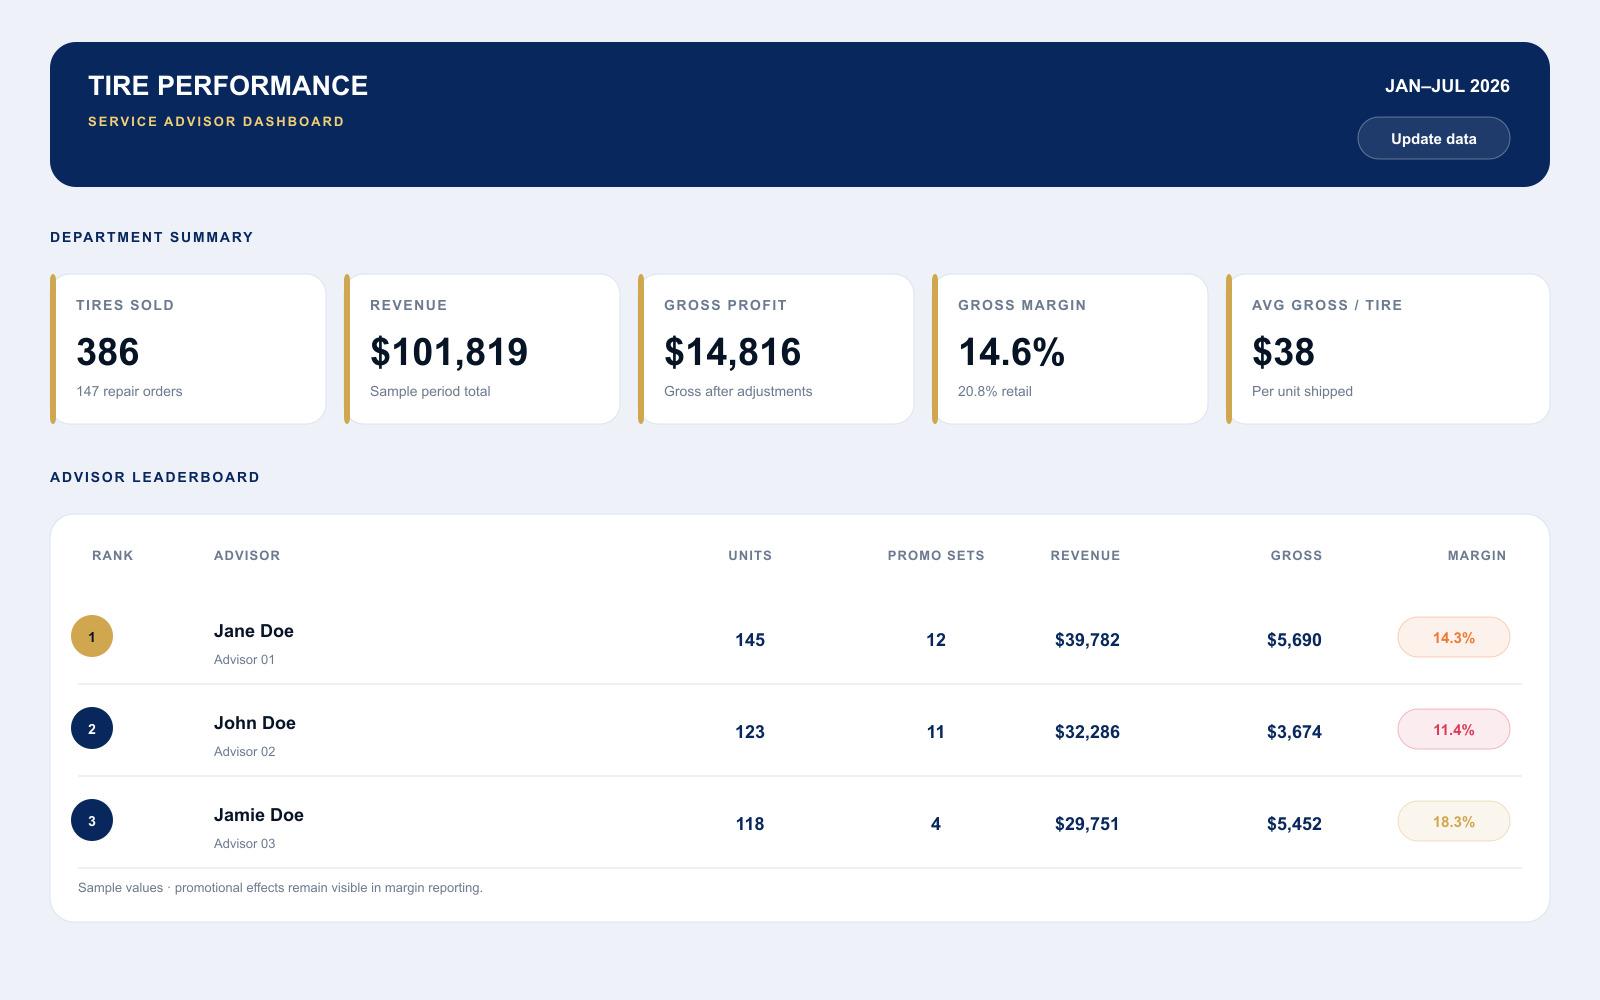
Supporting views show how raw inputs become a usable operating layer.
Capture privacy
The public mockups use Jane Doe, John Doe, and other synthetic names with sample performance figures. Customer-level identifiers, third-party branding, and browser URLs are excluded, and the live application is intentionally unlinked.
More work
Keep exploring.
Have a process like this?